
Litecoin (LTC) price is now following a bearish pattern against the U.S. Dollar, very similar to Bitcoin’s. LTC price could continue to drop as long as it is below $60.00.
In the last few sessions, we saw a continual decline in Bitcoin, Ethereum, Ripple, and Litecoin against the U.S. Dollar. LTC price couldn’t hold the $64.00 and $60.00 support levels, and it dropped to a more bearish zone.
The decline was massive as the price even changed hands below $58.00 and settled below the 55 simple moving average on the 4-hours chart. It then tested the $56.00 support zone, where the bulls took a stand, with a low forming near $56.61 and the price now consolidating losses.
Litecoin is in a Bearish Place
LTC is trading close to the 23.6 percent Fibonacci retracement level of the recent decline from the $62.95 high to $56.61 low. On the upside, the price is encountering a significant struggle near $60.00 and the 55 simple moving average on the 4-hours chart.
There’s also a bearish pattern line taking shape with resistance close to $60.00 on the 4-hours chart of the LTC/USD pair. The trend line is near the 50 percent Fibonacci retracement level of the prior drop from the $62.95 high to $56.61 low.
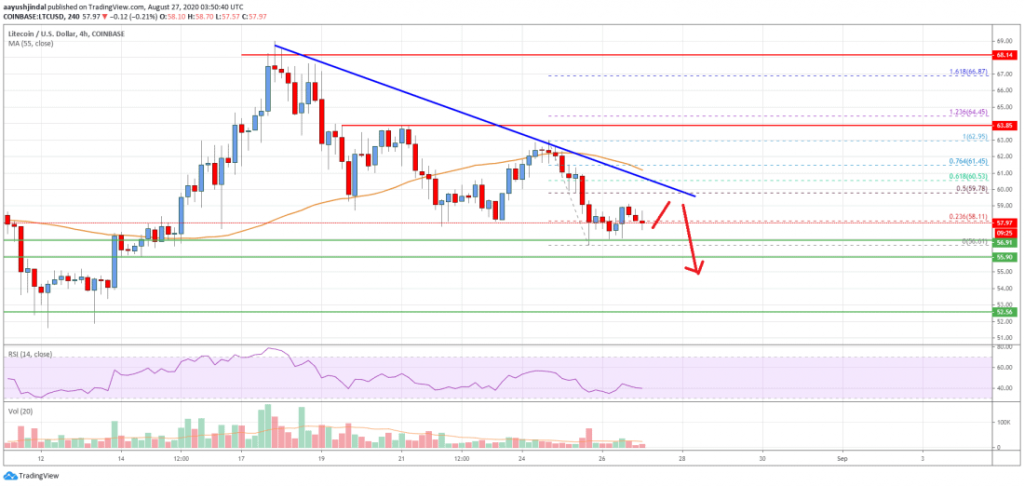
Hence, the price has to clear the $60.00 resistance area and the 55 simple moving average (4-hours) to start a good rise to the near term. The next significant resistance on the upside is close to the $63.80 and $64.00 levels.
On the other hand, the price might keep dropping below $57.00 and $56.00, and if there is a clear break below $55.00, the LTC price is probably going to test the $52.50 support level.
According to the chart, the Litecoin price is definitely trading in a bearish zone below the $60.00 line. Overall, the price has to break the $60.00 and $61.00 resistance levels in order to move into a bullish zone in the near term.